

In this blog post, I will summarize and review the article Exploring the linguistic landscape of geotagged social media content in urban environments by Tuomo Hiippala et al. The concept of virtual linguistic landscape was developed by Ivkovic and Lotherington (2009) to discuss multilingualism on the web. In their paper, Hiippala and his fellow researchers explore the virtual linguistic landscape of Senate Square in Helsinki, Finland, by analyzing the text of 117,418 Instagram posts that are geotagged to that location. I chose this paper because I have a passion for maps, geotagged storytelling, and exploring the relationship between physical, virtual, and literary space.
I divided my article according to the phases of text analysis illustrated in Nguyen et al, 2020 for ease of analysis. I joined the phases of Operationalization and Analysis in order to keep together the different measurements and their results.
Research Questions
- How to characterize virtual linguistic landscapes in terms of their linguistic richness and diversity?
- How do virtual linguistic landscapes change over time?
The research questions respond to a double goal: describing the virtual linguistic landscape both as a whole and in its evolution over time.
Data
Data Aquisition & Compiling Data:
The researchers used born digital data from Instagram posts, which that they collected using the platform’s API.
- 117,418 posts
- 74,051 unique users
- Posted between 4 July 2013 and 11 February 2018, that is, over a period of 4.5 years.
- Each post was geotagged to a POI (Point of Interest) located within a 150-m radius from the centre of the Senate Square in downtown Helsinki, Finland. The square is a celebrated landmark and was chosen for its likelihood of depicting a diverse virtual linguistic landscape.
The first consideration I have is of ethical nature: the researchers collected data from unsuspecting users, who did not give their explicit consent to the experiment. As we will see in the Operationalization phase, the researchers went even beyond analyzing the posts from Senate Square, which gets a little creepy.
The second issue, which I honestly didn’t think about until I re-read How we do things with words, is that of data quality. APIs are designed for commercial purposes, and this is likely to introduce biases in the data and into the research.
Labels and Metadata:
Data from Instagram comes with metadata, which include the geotagged position of the post, the day and time of publication, et cetera. Hiippala et al. used these metadata in their study, for example in their analysis to determine the evolution of the linguistic landscape over time.
In the data processing phase, the article mentions how researchers cleaned the data: “We then remove any words that begin with an @ symbol, which indicates a username”. This expression made me think that usernames were part of the data, even if only in the case of people citing others in their posts with the @ symbol. Luckily, the researchers did not share their data, but I find it quite unsettling that this sort of information is available for the taking.
Conceptualization
The researchers define linguistic richness as the number of unique languages per day, and the number of singletons, that is, how many languages appear only once a day.
Linguistic diversity needs to account for both the number of languages observed and their relative proportions.
Operationalization and Analysis
Annotation
First of all, the researchers created a ground truth. They selected a random sample of sentences, and two annotators examined them to determine the language they’re written in. The, they evaluated the accuracy of several language identification frameworks against the ground truth (the human-made annotations) and examined whether their performance would improve by excluding sentences with a low character count.
After some tries, they concluded that the fastText library and its pretrained model provided superior performance compared to langid.py and CLD2 regardless of the character threshold.
Data Pre-Processing
Data was preprocessed to remove emojis and smileys, excessive punctuation, multilingual hashtags and usernames, and sentence-level code-switching, as you can see in the table below.
![A list of 8 passages of preprocessing the data from the Instagram posts. Text:
1 The original caption includes hashtags, user mentions, and smileys and emojis
Great weather in Helsinki!!! On holiday with @username.:-) #helsinki #visitfinland
2 We begin by replacing any line breaks with whitespace and convert the emojis into their corresponding emoji shortcodes,
which are wrapped in colons
Great weather in Helsinki!!! On holiday with @username.:-) #helsinki #visitfinland:nerd_
face_&_sunny_&_passenger_ship:
3 The colons make finding the emojis easy using a regular expression, which we then apply to remove them
Great weather in Helsinki!!! On holiday with @username.:-) #helsinki #visitfinland
4 We then remove any words that begin with an @ symbol, which indicates a username
Great weather in Helsinki!!! On holiday with:-)#helsinki #visitfinland
5 Next, we remove any hashtags, that is, any words beginning with a #
Great weather in Helsinki!!! On holiday with:-)
6 Any remaining non-alphanumeric words in the caption, such as the smiley:-) are then removed using a regular expression
Great weather in Helsinki!!! On holiday with
7 Longer sequences of exclamation or question marks (e.g. !!!), full stops, and other kinds of punctuation are shortened to
just one of each character (e.g. !)
Great weather in Helsinki! On holiday with
8 These sequences can confuse the Punkt sentence tokenizer (Kiss and Strunk, 2006), which outputs a Python list
containing sentence tokens. These tokens are then fed to the language identification frameworks one at a time
[”Great weather in Helsinki!”, ”On holiday with”]](https://femethods2020.commons.gc.cuny.edu/files/2020/11/data-preprocessing-1024x456.png)
Further preprocessing caused a reduction in the dataset amounting to a loss of 17.31% of the data. The result was a dataset of 90,353 sentences in eighty unique languages posted over 1,662 days for analysing temporal changes in the virtual linguistic landscape.
Supervised and Unsupervised Models
Hiippala and his colleagues used a mix of supervised and unsupervised models. First, they used a supervised model to individuate the language of the posts. Then, they decided to focus on posts written in English by Finnish users, and to apply an unsupervised topic model to explore their use of language. Data was then processed with methods from the fields of ecology and biology to measure the linguistic richness and diversity of the posts. Moreover, the researchers performed temporal analyses at various timescales to examine changes in the virtual linguistic landscape.
Distribution of Languages over time (Supervised)
From the analysis of the sentence-level language distribution in the captions, researchers calculated the daily relative frequencies for the three most common languages— English, Finnish, and Russian—and the combined relative frequency for the remaining seventy-seven languages identified in the data (grouped together under the label ‘other’).
The Senate Square is a big tourist attraction, and it seems to be reflected in the fact that approximately half of the sentences are written in English. Moreover, Finland is a popular destination for Russians due to its proximity and accessibility, to the point where Finnish overtook Russian as the second most common language only in 2015. This might be explained by the fact that the decline of the Russian language coincides with the economic sanctions imposed on Russia due to the invasion of Ukraine, which caused the number of Russian tourists visiting Helsinki to dip in 2015 and 2016.
Hiippala and colleagues noticed that English seemed to be gaining most from the growing popularity of Instagram, being used as a lingua franca on social media. This led them to wonder who these English users were: how many non-native English speakers use this language on Instagram? And this is where things get a little creepy, in my opinion.
Language choices among users (Unsupervised: Topic Modeling)
To figure out which users are writing their captions in English, the researchers retrieved the time and location of posts for up to thirty-three previous posts for each user. Then, they determined the likely country of origin of the users by retrieving the administrative region of each coordinate/timestamp pair in the location history, used the timestamps to determine the overall duration of user’s activity within each region, and recorded the region with the most activity.
I don’t know, for some reason I find it a little disturbing that researchers went “fishing” into the users’ previous social media posts to determine where they are really from. Ah, what we agree to in the “Terms of Service”, just to see some cat videos!
Anyway, this analysis revealed that Finnish users post nearly as much in English as in Finnish. To describe the content of the English posts by Finnish users, Hiippala and colleagues trained a topic model over monolingual English captions posted by users whose country of origin was estimated to be Finland. The data consisted of 8,636 captions with 5,552 unique words.
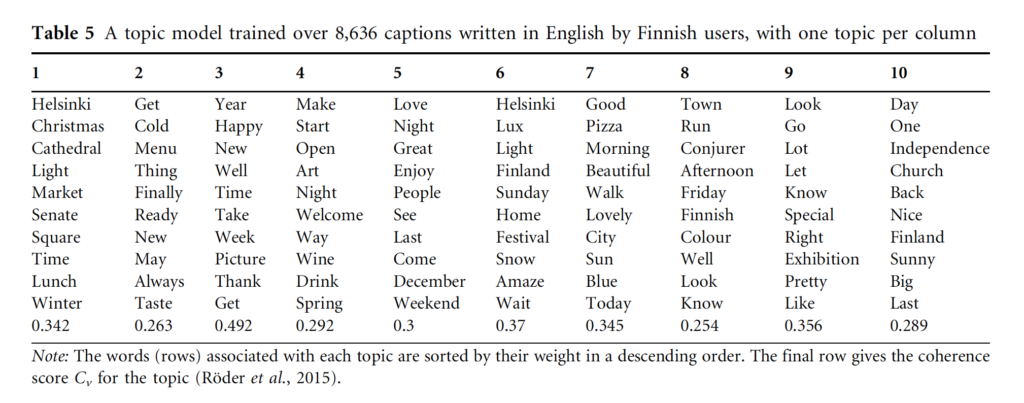
As you can see in the table, many topics have to do with the location, weather, leisure, and celebrations such as Christmas and New Year’s Eve (1 and 3) and the Lux light carnival (6). Many topics also feature words associated with a positive sentiment (3, 5–7,9, and 10). According to the researchers, these topics suggest that Finns use English to connect with international audiences, appraising the physical location and the activities associated with it in the virtual space.
The diversity of the virtual linguistic landscape
The researchers used methods derived from ecology and biology to measure the linguistic richness and diversity of their linguistic landscape.
Linguistic Richness is defined as the number of unique languages per day, and the number of singletons, that is, how many languages appear only once a day. The fact that unique languages and singletons proceed in parallel suggests that smaller languages are driving the increase in linguistic richness.
Menhinick’s richness index: emphasizes the relationship between data volume and richness. The index reveals a decreasing trend over the 4.5 years. This trend suggests that despite increasing linguistic richness, driven by the increase in smaller languages, the virtual linguistic landscape is increasingly dominated by languages such as English, Finnish, and Russian
Berger–Parker dominance index: Measuring the diversity of the virtual linguistic landscape requires indices that account for both the number of languages observed and their relative proportions. One such index is the Berger–Parker dominance index, which gives the fraction of observations for the language with the most posts per day. Berger–Parker index suggests that the dominant languages are losing ground to smaller languages, showing a drop of thirty points during the 4.5 years, which suggests that the virtual linguistic landscape of the Senate Square is becoming increasingly diverse.
Shannon Entropy: captures the amount of information required to describe the degree of order/disorder in a system. The higher the degree of disorder (the variety of languages and their probability of occurrence), the more information is required to describe the system. The fact that the Shannon Entropy index peaked in 2017 led the researchers to conclude that the virtual linguistic landscape reached its maximum degree of diversity, with over eight languages on an average day.
The authors’ final considerations were:
- The study confirmed the role of Senate Square both as a tourist attraction (high volume of posts by foreigners) and a beloved local landmark (high volume of posts by Finnish users). This fact aligns with Kellerman’s (2010) theory that the virtual space reflects characteristics of the physical space.
- The richness and diversity of the virtual linguistic landscape of Senate Square seems to confirm Lee’s (2016) theory that user-generated social media content increases the potential for exposure to foreign languages. Instagram, in particular, allows locations to be displayed with multilingual names, aggregating content in different languages.
Review
What I liked about this project is that it mixes supervised and unsupervised machine learning in a seamless way, providing an analysis that makes a lot of sense and is easy to follow. I also appreciated that the research questions did not fall into obvious binary categorizations (especially in terms of gender), and instead measured linguistic richness and diversity without value judgements. Another detail I enjoyed is the fact that the researchers tied certain statistical results, like the decline of the use of Russian in 2015, to socio-political events. I honestly wished they had done more of this kind of analysis, which is not only interesting but might give fruitful insights on the state of the world.
Text analysis of social media still makes me a little uncomfortable, especially for a platform like Instagram, which is used mostly for personal content. However, I appreciate that the researchers did not try to create a network analysis of users or other models that resemble the commercial uses of social media data. Instead, they tried to detect the general content of the posts, specifically to understand how, why, and for what purpose Finnish users write their captions in English. I never thought of using social media to explore sociolinguistic geography, so this is definitely an effective and compelling use of machine learning.
Bibliography
Hiippala, Tuomo, et al. “Exploring the Linguistic Landscape of Geotagged Social Media Content in Urban Environments.” Digital Scholarship in the Humanities, vol. 34, no. 2, June 2019, pp. 290–309. EBSCOhost, doi:10.1093/llc/fqy049.
Ivkovic, Dejan, and Heather Lotherington. “Multilingualism in Cyberspace: Conceptualising the Virtual Linguistic Landscape.” International Journal of Multilingualism, vol. 6, no. 1, Taylor & Francis Group, 2009, pp. 17–36. cuny-gc.primo.exlibrisgroup.com, doi:10.1080/14790710802582436.
Kellerman, Aharon. “Mobile Broadband Services and the Availability of Instant Access to Cyberspace.” Environment and Planning. A, vol. 42, no. 12, SAGE Publications, Pion Ltd, London, Sage Publications, Inc, 2010, pp. 2990–3005. cuny-gc.primo.exlibrisgroup.com, doi:10.1068/a43283.
Lee, Carmen. “Multilingual Resources and Practices in Digital Communication.” The Routledge Handbook of Language and Digital Communication, Routledge, 2016, pp. 118-132. www.academia.edu, https://www.academia.edu/15252858/Multilingual_resources_and_practices_in_digital_communication.